Air Trends
Air Quality Trends
On this page...
Air Quality Trends
EPA creates air quality trends using measurements from monitors located across the country. The table below shows that air quality based on concentrations of the common pollutants has improved nationally since 1980.
|
Percent Change in Air Quality
| ||||||||||||||||||||||||||||||||||||||||||
National and local air quality trends graphs showing the nation’s progress towards clean air are available for: carbon monoxide (CO), ozone (O3), lead (Pb), nitrogen dioxide (NO2), particulate matter (PM), and sulfur dioxide (SO2).
Emission Trends
EPA estimates nationwide emissions of ambient air pollutants and the pollutants they are formed from (their precursors). These estimates are based on actual monitored readings or engineering calculations of the amounts and types of pollutants emitted by vehicles, factories, and other sources. Emission estimates are based on many factors, including levels of industrial activity, technological developments, fuel consumption, vehicle miles traveled, and other activities that cause air pollution.
Emissions information is developed with input from state and local air agencies, tribes, and industry. EPA tracks a range of emissions data, including how much of each pollutant is emitted from various pollution sources. To view national, state, and local emissions summary data, see EPA’s Air Emission Sources site. The table below shows that emissions of the common air pollutants and their precursors have been reduced substantially since 1980.
|
Percent Change in Emissions
| ||||||||||||||||||||||||||||||||||||||||
Emissions of air pollutants continue to play an important role in a number of air quality issues. In 2010, about 90 million tons of pollution were emitted into the atmosphere in the United States. These emissions mostly contribute to the formation of ozone and particles, the deposition of acids, and visibility impairment.
The table below shows changes in national estimates of emissions for the common air pollutants or, where appropriate, the precursor pollutants that form them.
To get detailed information about emissions estimates displayed below, please visit EPA's Clearinghouse for Inventories and Emissions Factors (CHIEF).
|
National Emissions Estimates
| ||||||||||||||||||||||||||||||||||||||||||||||||||||||||||||||||||||||||||||||||||||||||||||
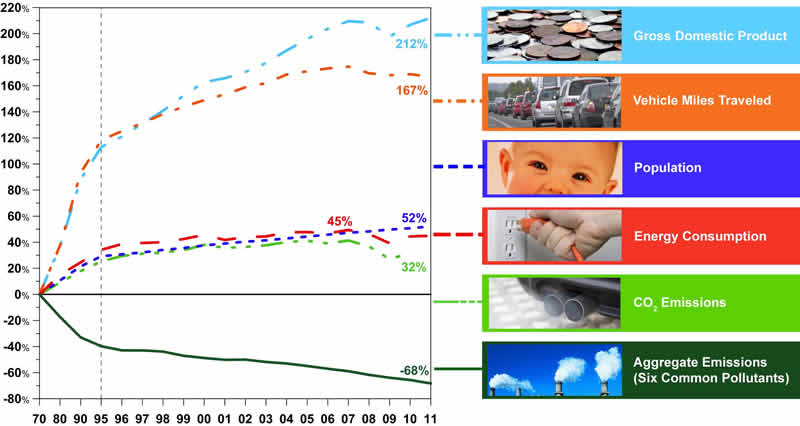
Annual emissions estimates are used as one indicator of the effectiveness of our programs. The graph below shows that between 1980 and 2011, gross domestic product increased 128 percent, vehicle miles traveled increased 94 percent, energy consumption increased 26 percent, and U.S. population grew by 37 percent. During the same time period, total emissions of the six principal air pollutants dropped by 63 percent. The graph also shows that between 1980 and 2010, CO2 emissions increased by 21%.
| Comparison of Growth Areas and Emissions, 1980-2011 |
 |
| Note: CO2 emissions estimate through 2010 (Source: 2012 US Greenhouse Gas Inventory Report) Gross Domestic Product: Bureau of Economic Analysis Vehicle Miles Traveled: Federal Highway Administration Population: Census Bureau Energy Consumption: Dept. of Energy, Energy Information Administration Aggregate Emissions: EPA Clearinghouse for Inventories and Emissions Factors |
(see the graphic above for 1970-2011)
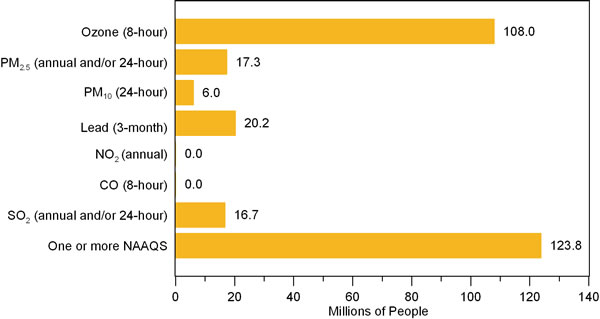
Despite great progress in air quality improvement, approximately 124 million people nationwide lived in counties with pollution levels above the primary NAAQS in 2010.
Number of People Living in Counties with Air Quality
Concentrations Above the Level of the NAAQS in 2010
|
Note: In 2008, EPA strengthened the national standards for 8-hour ozone to 0.075 ppm and the national standards for lead to 0.15 µg/m3. This figure includes people living in counties that monitored ozone and lead concentrations above the new levels.
In addition, from 1990 to 2005, emissions of air toxics declined by approximately 42 percent. These reductions are the result of implementing stationary and mobile source regulations. The majority of the air toxics emitted in 2005 are also precursors of ozone and/or particle pollution.
In recent years, EPA has acted to dramatically improve America's air quality by designing and developing national programs that, when fully implemented, will achieve significant reductions in air emissions. The associated air quality benefits will lead to improved health, longevity, and quality of life for all Americans.
Weather Influence
Weather conditions influence emissions and air quality. EPA has developed statistical approaches to account for weather’s influence on ozone and fine particles. While these approaches do not change the quality of air we breathe, they do help us understand how well emission reduction programs are working. More information on trends in ozone adjusted for weather conditions can be found at http://www.epa.gov/airtrends/weather.html.