UFO Sightings in Australia - - a short study
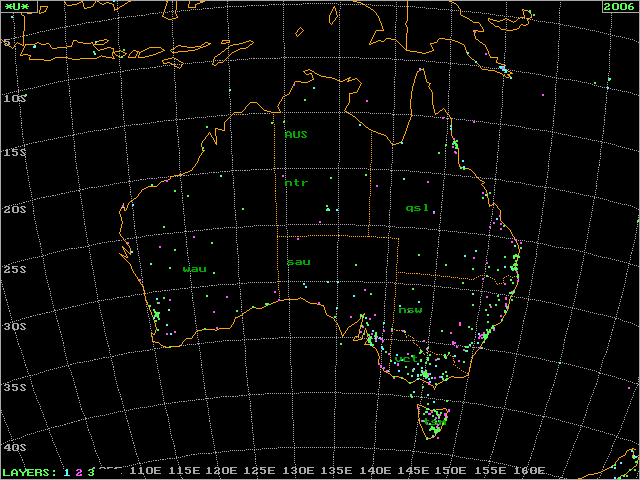
UFO Sightings in Australia The *U* UFO Database does not pretend to have complete data for Australia,   just what is available from this large list of sources in the literature compiled over 20 years.

For more complete and up to date to date information, readers are recommended to the works of Keith Basterfield,   Bill Chalker  and others in Australia itself.

On this map, sightings are overlaid by three eras:   145 events from 1868 through 1959 show as Blue dots.   197 from 1960 through 1974 are in Violet, and 309 from 1975 to the present are in Green.

The geographical center of these sightings is at 142:45E - 32:56S which is maybe 30 km Southeast of Menindee, New South Wales.

Like the population, most sightings are on the southeast coast of Australia.

See a separate but similar study of
UFO in New Zealand.


Daily UFO Sightings Histogram: Australia <=   Daily Histogram: Australian UFO Sightings.
Here all sightings are combined, then given as daily counts to show seasonal effects and trends.

While its not obvious, May stands out as the busiest month all years combined,   81 *U* records versus an average of only 52 for the other eleven months.

The earliest sighting is weak, possibly a dream?   On 25 July 1868 in Paramatta, NSW an engineer saw a talking head which invited him aboard a 'Flying Ark'.     Be sure to see this most interesting account by   Bill Chalker 

Five years later (9 March 1873) the same man saw two brown clouds extend "screws" downward.   What we now call a saucer appeared between the screws.

On 11 June 1881, the British Prince of Wales and 13 others aboard a ship between Melbourne and Sydney witnessed a "glowing phantom vessel" in the sky.


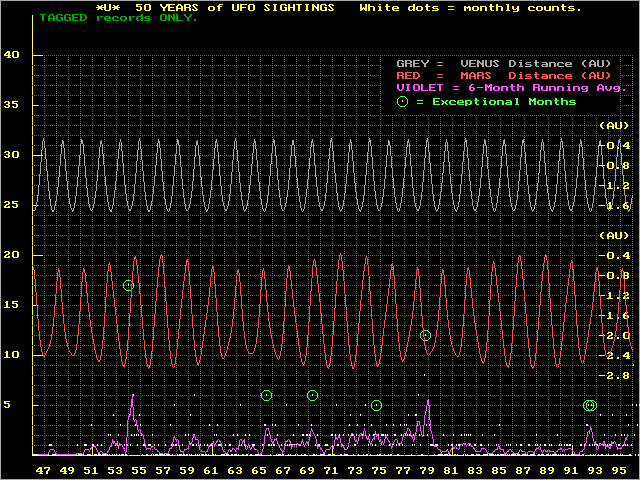
50-year graph of Australian UFO Sightings <=   50-Year Graph of Australian UFO Sightings.
Most notable are two sharp peaks in 1954 and 1978, with nearly constant activity in between.
No other country shows this.

The busiest years for Australia were:
1954 (50)     1959 (19)     1965 (19)     1969 (19)
1971 (16)     1972 (15)     1973 (23)     1974 (19)
1976 (18)     1977 (26)     1978 (43)     1979 (15)
1992 (21)     1995 (15)     1996 (38)     1997 (18)

Years not shown list 14 or fewer events.
Data are incomplete for more recent years.

The busiest single month was January 1954 predating the Great French UFO Wave of 1954 by 8 or 9 months.

In September, October and November of 1954, while Europe saw the greatest wave of UFO sightings in this database, Australia slowed to only one or two events per month.


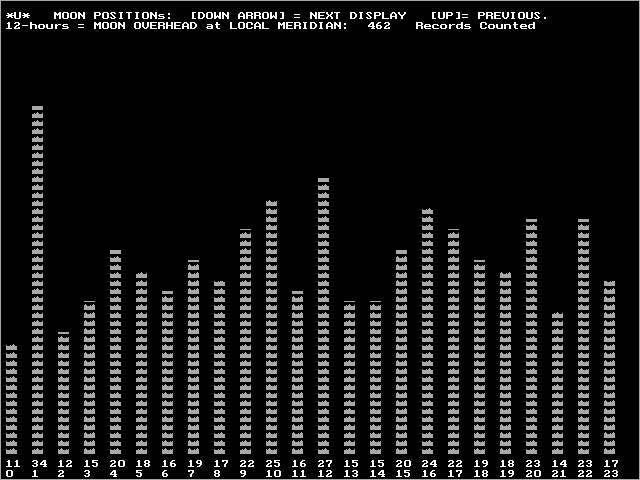
Lunar Positions during Australian UFO Sightings <=   Lunar Positions during UFO Sightings.

This histogram shows lunar positions during UFO sightings.   This has nothing to do with day versus night, nor the phases of the moon, but only Lunar positions with respect to Zenith and horizon.

At position 12, the moon is nearly overhead, on the same meridian as the UFO event.   At positions 6 and 18, the moon is at or near the horizon.

At position 1, the moon is nearly straight down, i.e. well underfoot.   Note the peak of sightings at those times.

Keeping in mind the dangers of small-number statistics, there is another coincidence.   For the 20 year period from 1955 to 1974 inclusive, odd numbered years totalled 64 percent more sightings than even numbered years,   151 events versus 91.

The following 20 years (1975 thru 1994) saw a near reversal of this, even years counting 130 events versus 109 for odd years.

Return to :   *U* UFO Home     USA States UFO Studies     World UFO Maps     Regional UFO Maps     Thematic UFO Maps
See Also :   Southeast Asia     Asia Pacific     Indian Ocean     Southern Africa     New Zealand Special UFO Study       [Site Map]